community scientists,
whale enthusiasts and
researchers.
Marine Mammal Detections
The detections displayed on Spyhopper come from a number of sources. Visual sightings come from groups such as the Spyhopper Marine Mammal Research Team (SMMRT), Southern Gulf Islands Whale Sighting Network (SGIWSN), Howe Sound Cetacean Sightings Group (HSCSG), who primarily use the Oceanwise Whale Report App to record sightings. Acoustic detections come from hydrophone systems operated in the Salish Sea by organizations including Saturna Island Marine Research and Education Society (SIMRES) and JASCO Applied Sciences. To learn more about the groups that provide data to Spyhopper, check out the 'About Us' for more details.
Though not all on public display, we currently maintain a database that incorporates marine mammal detections from multiple sources including visual sightings (from multiple citizen scientist groups and researchers), acoustic detections (from sites operated by NGOs and government agencies) and we have the potential to expand to other detection methods. The heatmap shown here is an example of the killer whale detections and tracks in the Salish Sea for 2020-2024 (red lines represent Southern Resident Killer Whales and blue lines represent Bigg's Killer Whales). The concentration of detections reflects the location of where most of the contributors are based.
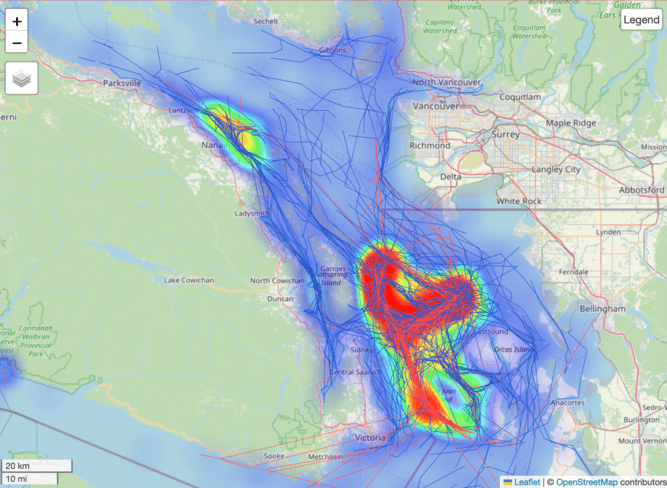
Photo and Audio Galleries
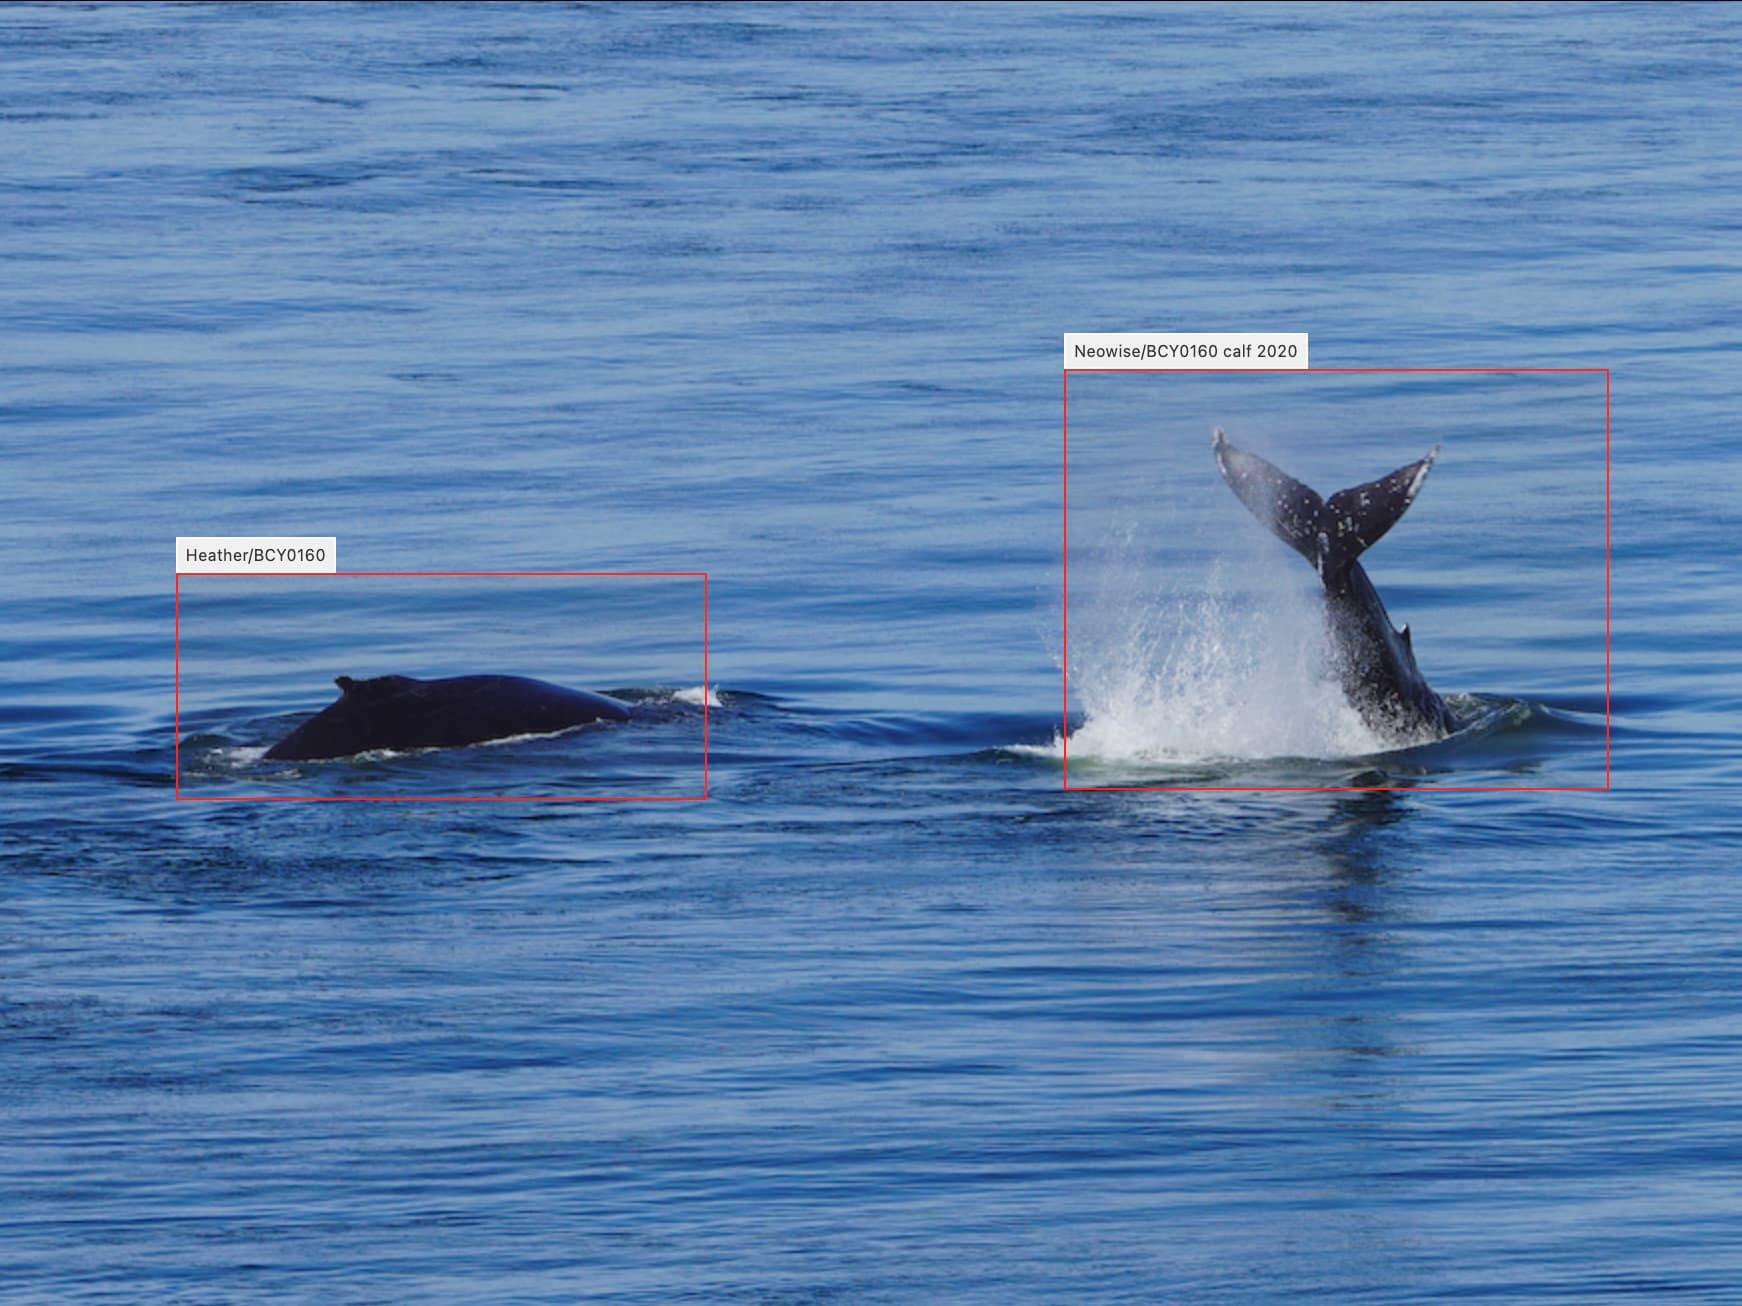
Photographs and audio clips are uploaded to Spyhopper by contributors or by members of the SMMRT. The addition of these media to detections enables a higher level of confidence in the detection and can be used to confirm the presence of a species or individual.
Photographs can be found in the Photo Gallery by navigating to the Photo tabs or by clicking on individual sightings in the Map tab. In the Photo Gallery, you can filter by organization/contributor/location, or by species/population/individual. Photos are tagged by the SMMRT validators when the photographed individual can be confirmed using the Admin only tagging feature.
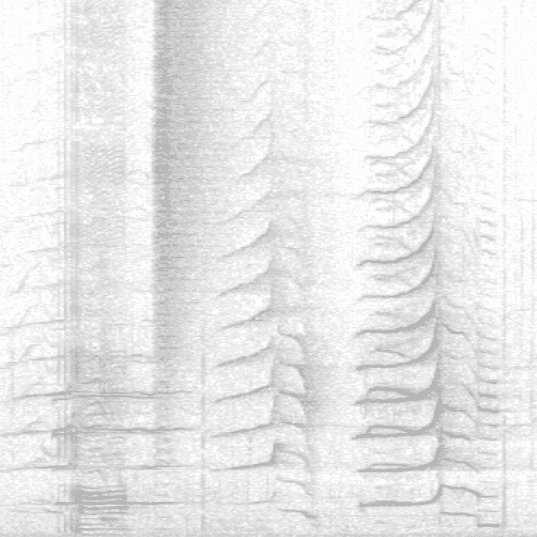
Audio clips can be found in the Audio Gallery by navigating to the Audio tabs or by clicking on hydrophone icons in the Map tab. The spectrograms are generated as part of the the audio upload procedure. While not all audio detections have linked audio clips, all audio detections on Spyhopper have been validated by the contributing organization or by SMMRT validators.
Map Features
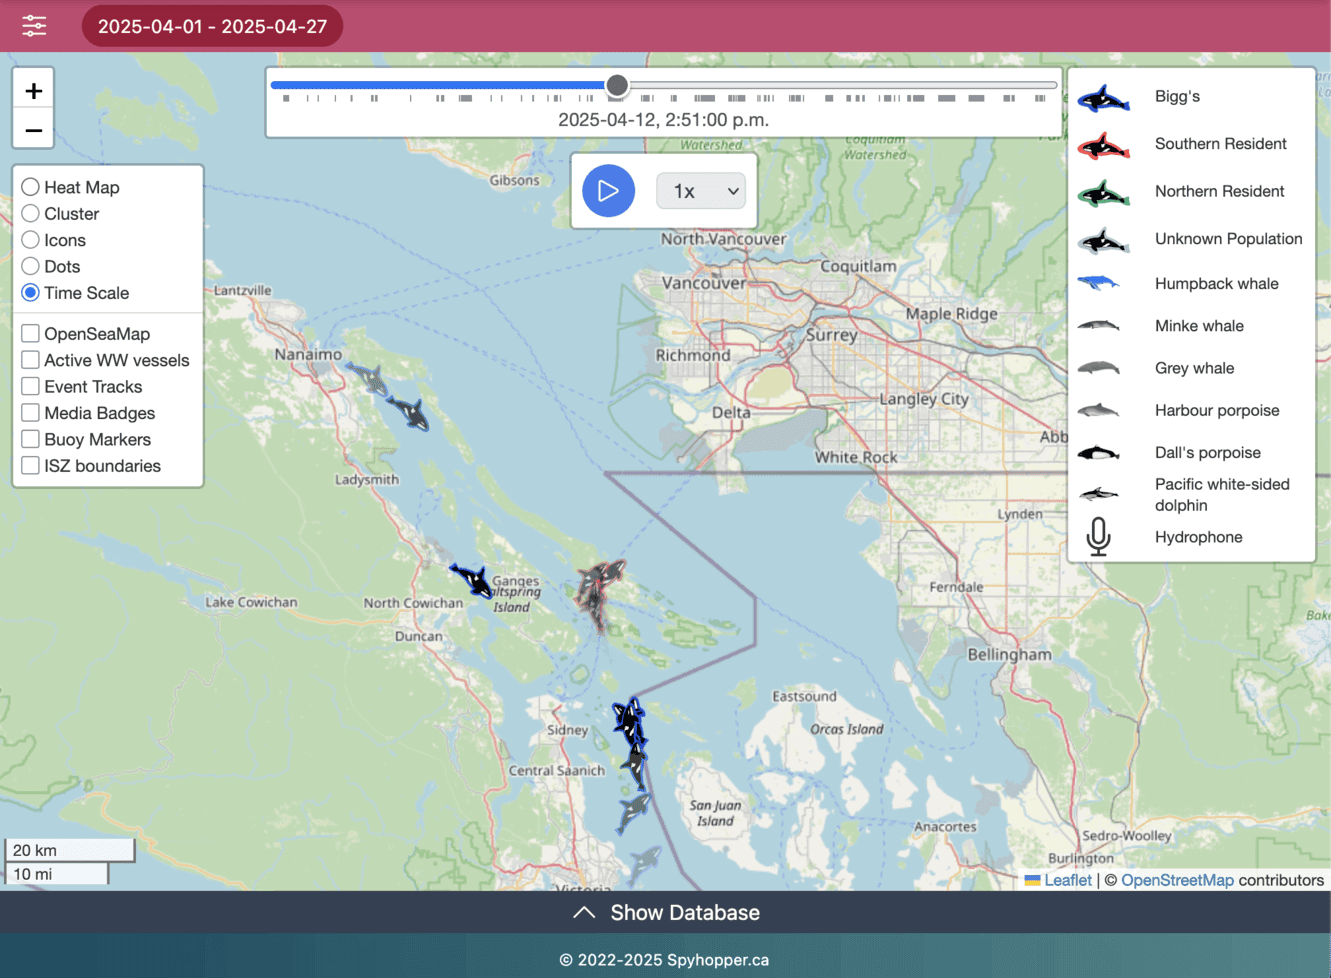
The Map tab is where you can view detections on a map. There are numerous options to customize the map view. As with other tabs, you can make filter selections to refine the data that you want to display. You can click on individual reports for more information on the specific detection and view detection media (if available). The default view is to cluster all detection in the Salish Sea for the current week. Other view options include Icons (without clustering), Dots (an alternative option to icons), Heatmap (colour coded to show the density of detections in an area) and Time scale. Other map features are described below.
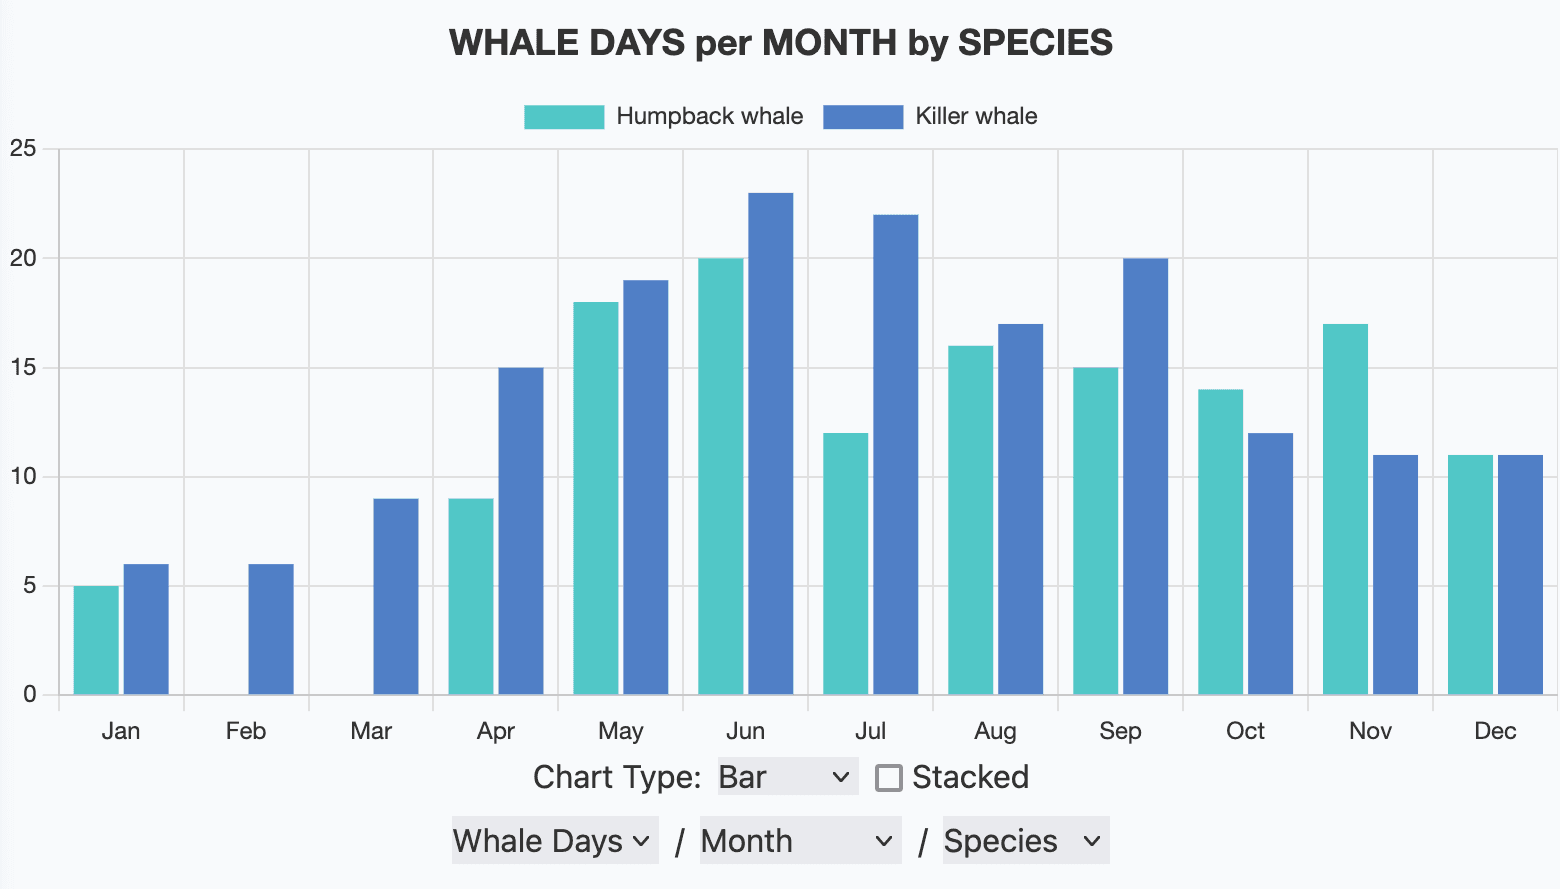
Charts
The dynamic chart is a feature where you can play around with the data yourself. As with other features, the data can be refined by adjusting filters such as the date range, location, organization/contributor, or the species/population/individual. There are options for the type of graph (bar, line, scatter), the data to be used on the y axis (whale detections, whale days or hour of detection), x axis (eg day of year, date, year, species etc.) and how the data is grouped (eg by year, month, species etc.). Examples of the charts are shown below.